Introduction
This is a rough post-facto analysis of the behaviour of the ICYMI (ADN) bot. The bot spits out some rudimentary logs as it works (in fact as part of how it processes creating a list of toots to boost, and tracking which of those it has boosted and which it still has to boost) and this stores high-level data about the promoted toots (but not the discarded ones). I use the logs along with data drawn from the server using the rtoot library to slice and dice the data and try to present the data graphically. This is still largely an exploratory rather than explanatory exercise.
The bot was offline for the second half of July and the first half of August. There has been some adjustment of the graphing code to reflect this.
Publication of this month’s analysis has been delayed because I have spent time figuring out how to explore the scoring of toots boosted by day of week, and then spent a bit more time on some cosmetic adjustments to charts. Some of the older charts which weren’t telling me very much have also been dropped.
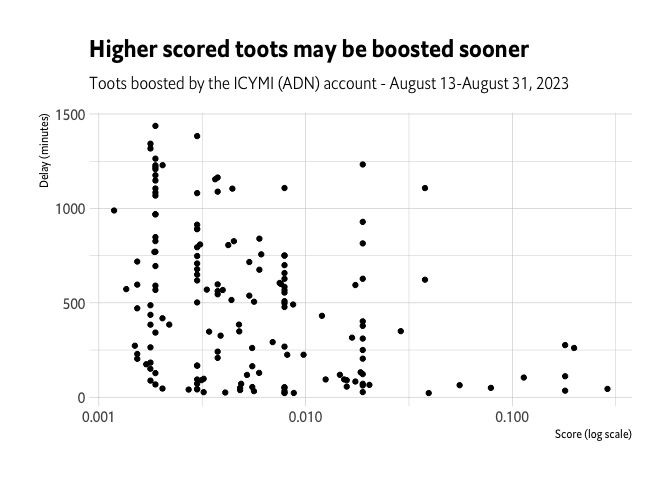
Time delay
This graph compares the delay between when a toot is created and when the bot boosts it. As last time, higher scoring toots tend to be boosted sooner after their initial creation – which makes sense considering how the bot scores toots and considers which to boost.
Scores and time
The bot assigns a score to each toot it sees, then boosts the toots which get the highest score. This can mean that when there aren’t many toots, toots with lower scores might get boosted which otherwise wouldn’t be amplified.
After saying the same thing (paragraph above) a few times I’ve finally worked on how to consider this question. Thanks to writing this analysis in R and having somewhat reusable code, it’s quite quick, having once got it to work on July, to run it again for August.
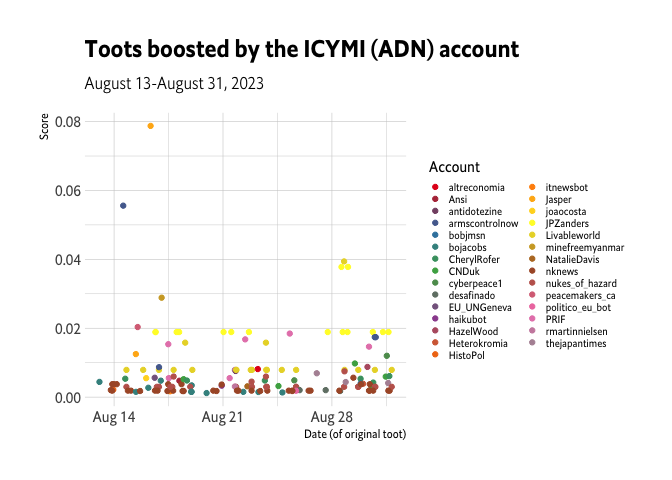
I was about to drop the old scatter graphs but have kept them - they show what a range of accounts are boosted, something of the range of scores assigned, but if you’ve read this analysis before you may want to skip to the day of week variation, below.

But even when I crop out the outliers, there’s not much visible pattern to see, except fewer toots boosted on weekends.
Accounts boosted
Anyone who follows the bot and will see that it tends to boost some accounts a lot. This isn’t very surprising since (a) it doesn’t follow many accounts and (b) even those accounts who do post about ADN topics don’t all consistently use the hashtags which the bot listens for.
Still, a histogram shows that nknews, nukes_of_hazard and Livableworld are most likely to score well and be boosted. This month, Jean-Pascal Zanders (@JPZanders@mastodon.world) runs a close fourth!

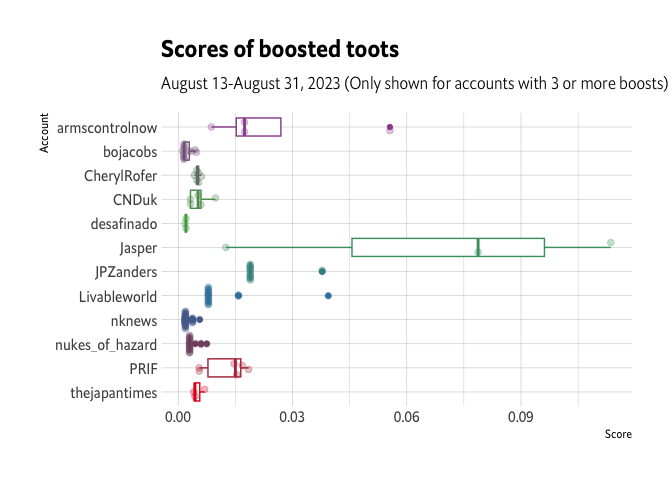
Scores of toots from regularly boosted accounts
Looking at the scores of toots from the most frequently boosted accounts, there is some variation.
Day of week variation
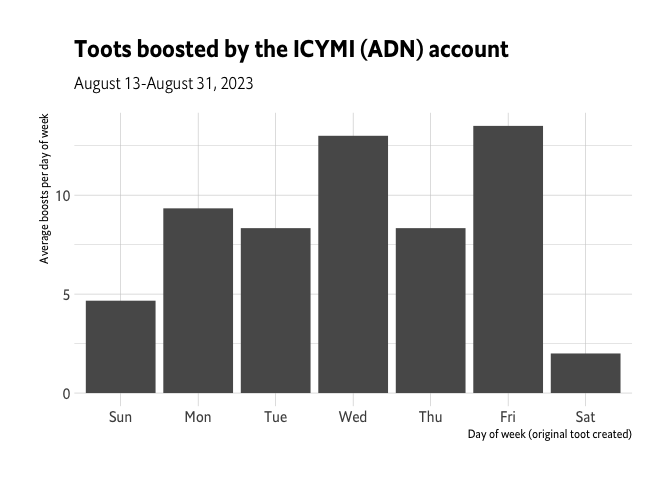
There always seemed to be some weekly cycle in the scores of the toots boosted. Looking at July (having finally corrected for the fact that for any month (except most Februaries), some weekdays happen 4 times and some happen 5 times), we saw that the bot boosted mostly on Wednesday and Friday, and it’s roughly similar in August, with some even stronger variation on weekends. This last might be due to the happenstance of when I plugged the computer back in and got the bot running again.
Scoring by day of week
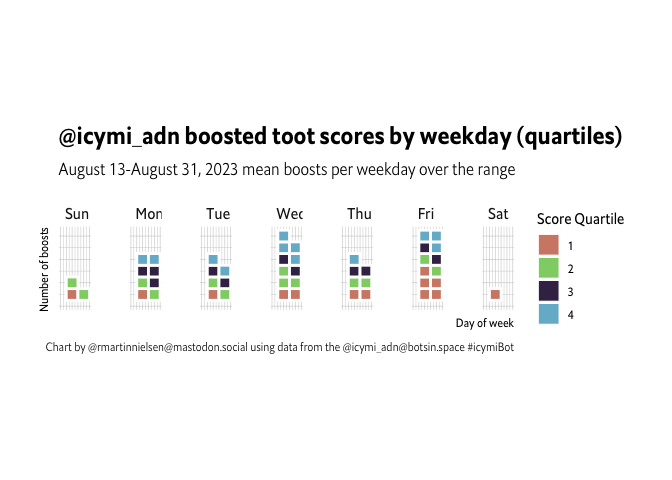
That was a very boring monochrome chart, but if we break all the boosted toots into four quartile boxes from lowest to highest quartile by score, and then look at which quartiles show up across which weekdays, we get an interesting picture (as in July). These charts are made using Bob Rudis’ (@hrbrmstr@mastodon.social) waffle library.
This chart isn’t just colourful, it also again shows that Wednesday and Friday have roughly comparable numbers of boosts. This time quality is better relatively on Wednesday than on Friday.
Sites referred to
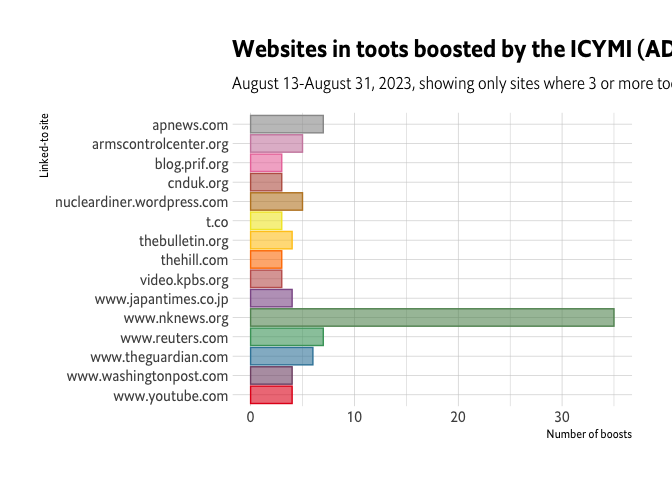
Looking at which sites the toots link to there is greater variation, though www.nknews.org, gets 36% of the links.
Beyond that, there is a mix of press, NGOs, and other specialised media outlets.
Keyword frequency and topic analysis
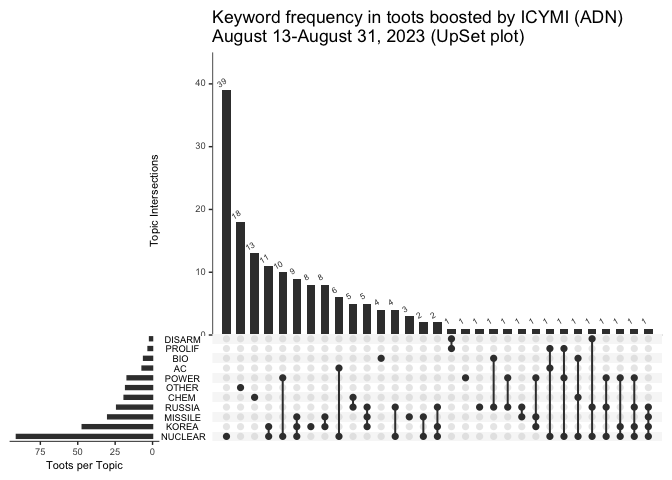
A very very basic keyword search was used to mark all boosted toots based on the content of the toot (not any linked site). This was then used to look at which topics are most frequently referred to, and where they may overlap.
More than half (56%) all the toots referred to nuclear, followed by Korea (29%) , “missile” (19%) and Russia (15%). This month, “Korea” and “missile” together (15%) came about as frequently than “Korea” and “nuclear” (15%). 18 of the boosted toots (out of 162 total – 11%) didn’t fall into any category.
“nuclear” and “power” appear together in 14 toots. The bot may be amplifying toots about nuclear power plants, but nuclear weapons are regularly discussed as tools of state power.
Comments
The analysis for August is somewhat abbreviated since there is less data, but I’m pleased with being able to look at evolution of the scoring across weekdays.
In the next couple of weeks I also want to try putting all the data for the past 6 months of running the #icymiBot together and see if there are any trends which show up across a longer period. This will take some data janitor work.
